
| 일 | 월 | 화 | 수 | 목 | 금 | 토 |
|---|---|---|---|---|---|---|
| 1 | ||||||
| 2 | 3 | 4 | 5 | 6 | 7 | 8 |
| 9 | 10 | 11 | 12 | 13 | 14 | 15 |
| 16 | 17 | 18 | 19 | 20 | 21 | 22 |
| 23 | 24 | 25 | 26 | 27 | 28 | 29 |
| 30 |
- NOSQL
- slack
- mongo
- postgresql
- 6.2.7
- vacuum
- RDBMS
- online ddl
- Docker
- MyISAM
- Connection
- ncloud
- mysql
- maxclients
- OD
- Maria
- REDIS
- autovacuum
- DELETE
- opensource
- RDS
- jmeter
- zabbix
- DML
- Cloud DB for MySQL
- NCP
- 성능테스트
- InnoDB
- cdb
- percona
- Today
- Total
개인 공부
Maria Replication 모니터링 ( feat. Zabbix ) 본문
고객으로부터 Maria Replication이 깨졌을 때 Alerting이 오도록 구성 요청을 받아서 테스트하게 되었다.
■ Zabbix Server 설치
2021.11.22 - [Open Source 툴] - 오픈소스 모니터링 Zabbix 5.0 설치
오픈소스 모니터링 Zabbix 5.0 설치
Zabbix는 시스템, DB, Network등 여러 지표를 이용하여 사용자에게 서버의 상태를 보여주는 오픈소스 모니터링 솔루션이다. 주요 특징으로는 중앙 집중형 모니터링, 분산 모니터링 지원 다수의 플랫
yunhyeonglee.tistory.com
■ 테스트 서버 정보
| Public IP | Private IP | |
| Zabbix Server | 49.50.160.212 | 192.168.100.113 |
| mysql002 ( Slave ) | - | 192.168.100.112 |
| mysql001 ( Master ) | - | 192.168.100.111 |
■ 방화벽 설정
- Zabbix-Server와 DB 서버 간의 10050 / 10051 Port가 허용되어야 한다.
■ Zabbix-Agent 설치 ( DB Node 전체 )
- Replication이 구성되어있는 DB 서버에 Zabbix-Agent 설치
- zabbix_agentd.conf 설정 변경
* Server=192.168.100.113 ( Zabbix Server IP )
* ServerActive 주석 추가
* Hostname=192.168.100.111 ( Agent Server IP )
[root@mysql001 ~]#  rpm -Uvh http://repo.zabbix.com/zabbix/5.0/rhel/7/x86_64/zabbix-release-5.0-1.el7.noarch.rpm
Retrieving http://repo.zabbix.com/zabbix/5.0/rhel/7/x86_64/zabbix-release-5.0-1.el7.noarch.rpm
warning: /var/tmp/rpm-tmp.oLBgCN: Header V4 RSA/SHA512 Signature, key ID a14fe591: NOKEY
Preparing...                          ################################# [100%]
Updating / installing...
   1:zabbix-release-5.0-1.el7         ################################# [100%]


[root@mysql001 ~]# yum -y install zabbix-agent


[root@mysql001 ~]# vi /etc/zabbix/zabbix_agentd.conf
Server=192.168.100.113
#ServerActive=127.0.0.1
Hostname=192.168.100.111


[root@mysql001 ~]# systemctl start zabbix-agent


[root@mysql001 ~]# ps -ef | grep zabbix
zabbix     5213      1  0 14:41 ?        00:00:00 /usr/sbin/zabbix_agentd -c /etc/zabbix/zabbix_agentd.conf
zabbix     5214   5213  0 14:41 ?        00:00:00 /usr/sbin/zabbix_agentd: collector [idle 1 sec]
zabbix     5215   5213  0 14:41 ?        00:00:00 /usr/sbin/zabbix_agentd: listener #1 [waiting for connection]
zabbix     5216   5213  0 14:41 ?        00:00:00 /usr/sbin/zabbix_agentd: listener #2 [waiting for connection]
zabbix     5217   5213  0 14:41 ?        00:00:00 /usr/sbin/zabbix_agentd: listener #3 [waiting for connection]
root       5219   2799  0 14:41 pts/0    00:00:00 grep --color=auto zabbix
■ MySQL 모니터링 Config 설정 ( DB Node 전체 )
- Zabbix Agent를 설치한 후 MySQL 모니터링을 위한 Config 설정이 필요하다.
- Monitoring 용 MySQL User 생성
- zabbix_agentd.d에 template_db_mysql.conf 파일 생성 ( MySQL에서 Zabbix 서버로 어떤 정보들을 넘겨줄 때 사용된다 )
*template_db_mysql.conf 내용 URL : https://git.zabbix.com/projects/ZBX/repos/zabbix/browse/templates/db/mysql_agent-
Browse Zabbix / Zabbix - ZABBIX GIT
git.zabbix.com
- DB 설치 시 Yum으로 설치하게 되면 4번의 심볼릭 링크를 설정할 필요 없음 ( 현재 DB를 Binary로 설정하여 MySQL 명령어가 다른 곳에 위치하기 때문에 심볼릭 링크를 걸어주었다 )
##1. Monitoring용 MySQL User  생성 ( Master 서버 )
MariaDB [(none)]> create user 'monitor'@'%' identified by 'monitor';
Query OK, 0 rows affected (0.00 sec)

MariaDB [(none)]> create user 'monitor'@'localhost' identified by 'monitor';
Query OK, 0 rows affected (0.00 sec)

MariaDB [(none)]> grant all on *.* to 'monitor'@'%';
Query OK, 0 rows affected (0.00 sec)

MariaDB [(none)]> grant all on *.* to 'monitor'@'localhost';
Query OK, 0 rows affected (0.00 sec)

MariaDB [(none)]> flush privileges;
Query OK, 0 rows affected (0.00 sec)

##2.모니터링 시 DB에 접속할 계정 정보가 저장된 my.cnf 파일 생성 ( 모든 서버 )
[root@mysql001 ~]# mkdir -p /var/lib/zabbix
[root@mysql001 ~]# vi /var/lib/zabbix/.my.cnf

[client]
user=monitor
password=monitor


##3.zabbix_agentd conf 설정 ( 모든 서버 )
[root@mysql001 ~]# cd /etc/zabbix/zabbix_agentd.d/
[root@mysql001 zabbix_agentd.d]# vi template_db_mysql.conf

#template_db_mysql.conf created by Zabbix for "Template DB MySQL" and Zabbix 4.2
#For OS Linux: You need create .my.cnf in zabbix-agent home directory (/var/lib/zabbix by default)
#For OS Windows: You need add PATH to mysql and mysqladmin and create my.cnf in %WINDIR%\my.cnf,C:\my.cnf,BASEDIR\my.cnf https://dev.mysql.com/doc/refman/5.7/en/option-files.html
#The file must have three strings:
#[client]
#user='zbx_monitor'
#password='<password>'
#
UserParameter=mysql.ping[*], mysqladmin -h"$1" -P"$2" ping
UserParameter=mysql.get_status_variables[*], mysql -h"$1" -P"$2" -sNX -e "show global status"
UserParameter=mysql.version[*], mysqladmin -s -h"$1" -P"$2" version
UserParameter=mysql.db.discovery[*], mysql -h"$1" -P"$2" -sN -e "show databases"
UserParameter=mysql.dbsize[*], mysql -h"$1" -P"$2" -sN -e "SELECT COALESCE(SUM(DATA_LENGTH + INDEX_LENGTH),0) FROM INFORMATION_SCHEMA.TABLES WHERE TABLE_SCHEMA='$3'"
UserParameter=mysql.replication.discovery[*], mysql -h"$1" -P"$2" -sNX -e "show slave status"
UserParameter=mysql.slave_status[*], mysql -h"$1" -P"$2" -sNX -e "show slave status"

##4.mysql 관련 명령어 심볼릭링크 설정 ( 모든 서버 )
[root@mysql-lee zabbix_agentd.d]# ln -s /data/maria/bin/* /bin/

##5.Zabbix Agent 재부팅 ( 모든 서버 )
[root@lee-zabbix ~]# systemctl restart zabbix-agent
■ Zabbix Server에서 DB서버의 정보를 읽어오는지 확인
- Zabbix-get을 이용해서 양쪽 DB 서버에서 정보를 받아오는지 확인한다.
[root@slave data]# yum -y install zabbix-get

[root@slave data]# zabbix_get -s 192.168.100.111 -k mysql.db.discovery["localhost","3306"]
information_schema
mysql
performance_schema
test


[root@slave data]# zabbix_get -s 192.168.100.112 -k mysql.db.discovery["localhost","3306"]
information_schema
mysql
performance_schema
test
■ Zabbix Server DB Host 추가
- Master / Slave Node 추가
1) 설정 -> 호스트 -> 호스트 작성

2) 호스트명 / 그룹 ( Zabbix servers ) / IP주소 DB 서버 IP 작성 후 Template 탭으로 이동

3) 템플릿 -> Templates/Databases -> Template DB MySQL by Zabbix agent 추가

4) Master / Slave 추가 후 Host의 ZBX 상태가 활성화돼있는지 확인
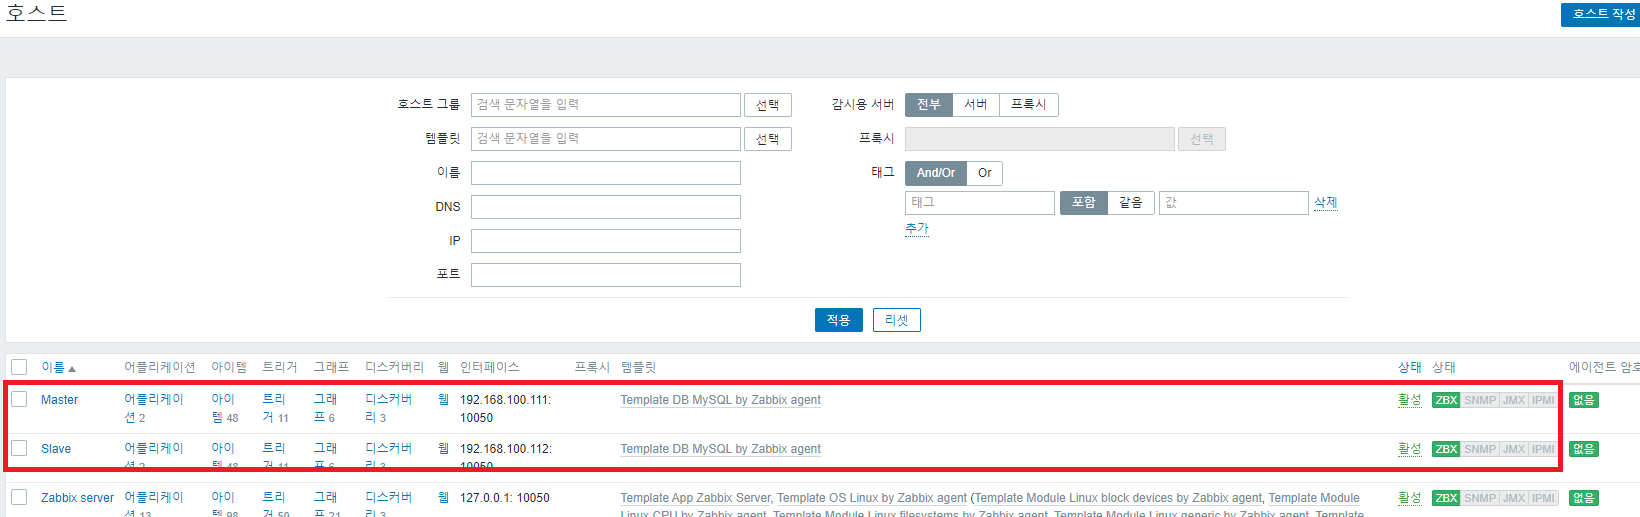
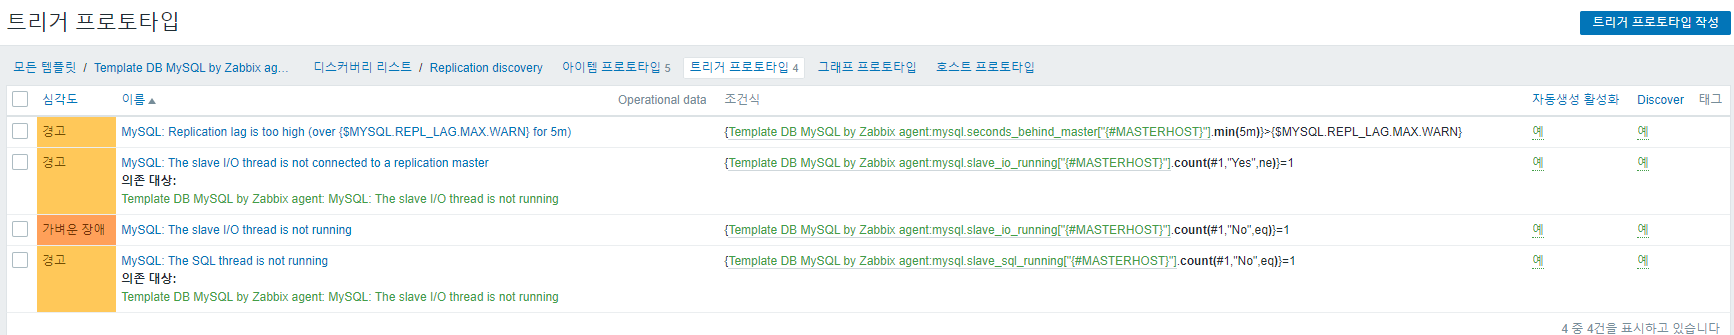
* Template DB MySQL by Zabbix agent 템플릿의 트리거를 보면 Slave의 SQL thread / Slave IO thread가 No가 되면 경고를 보내게 되어있다.
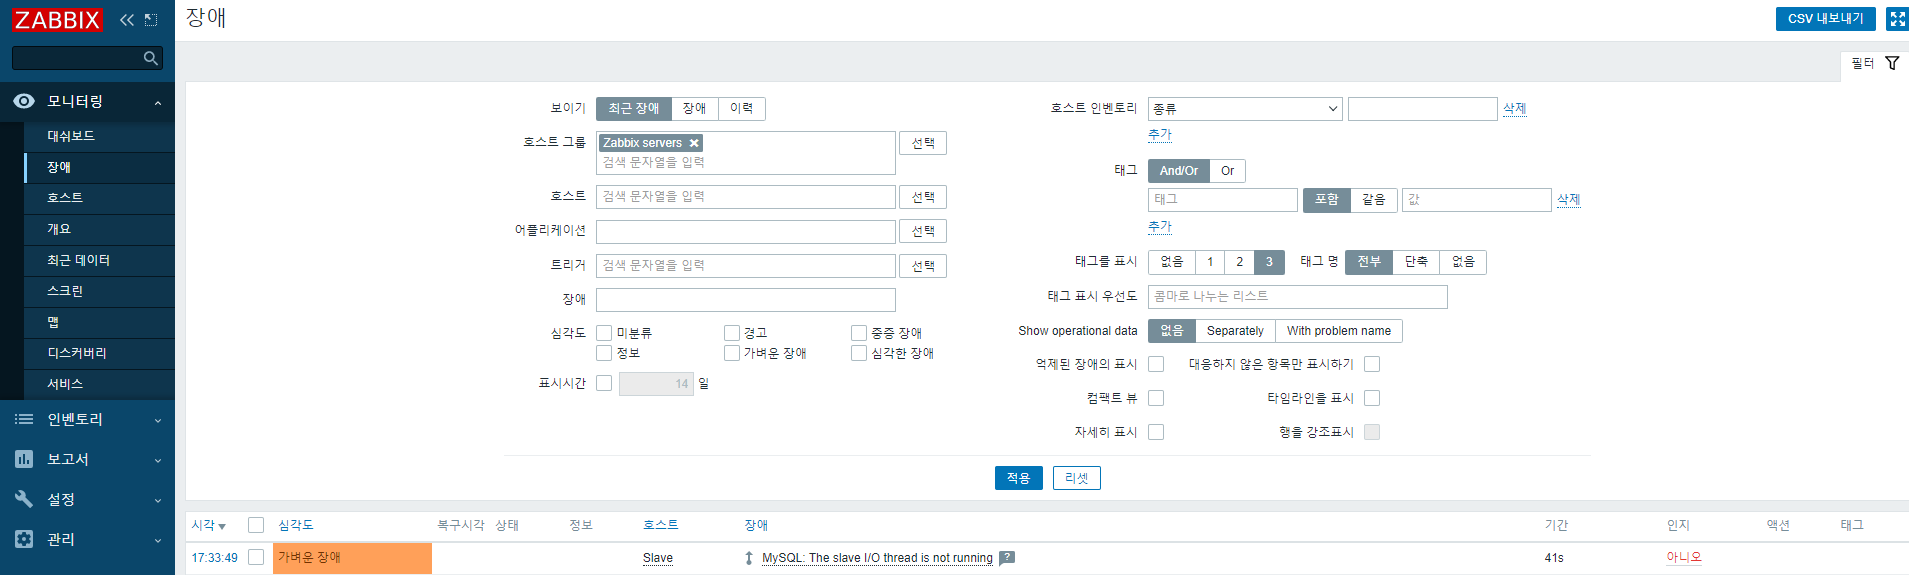
■ Replication 장애 발생 후 경고 확인
- Slave에서 Replication을 Stop 하고 Zabbix에서 경고가 뜨는지 확인
##1. 현재 Slave 상태

MariaDB [(none)]> show slave status\G
*************************** 1. row ***************************
               Slave_IO_State: Waiting for master to send event
                  Master_Host: 192.168.100.111
                  Master_User: repl
                  Master_Port: 3306
                Connect_Retry: 10
              Master_Log_File: mysql.000001
          Read_Master_Log_Pos: 1400
               Relay_Log_File: mysql-relay-bin.000003
                Relay_Log_Pos: 508
        Relay_Master_Log_File: mysql.000001
             Slave_IO_Running: Yes
            Slave_SQL_Running: Yes


##2. Stop Slave
MariaDB [(none)]> stop slave;
Query OK, 0 rows affected (0.01 sec)

MariaDB [(none)]> show slave status\G
*************************** 1. row ***************************
               Slave_IO_State:
                  Master_Host: 192.168.100.111
                  Master_User: repl
                  Master_Port: 3306
                Connect_Retry: 10
              Master_Log_File: mysql.000001
          Read_Master_Log_Pos: 1400
               Relay_Log_File: mysql-relay-bin.000003
                Relay_Log_Pos: 508
        Relay_Master_Log_File: mysql.000001
             Slave_IO_Running: No
            Slave_SQL_Running: No
- 모니터링 -> 장애 탭으로 들어가서 알림을 보면 Slave not running 이 뜬것을 볼 수 있다.
'Open Source 툴' 카테고리의 다른 글
| Zabbix Agent 배포 ( Use. Ansible ) (0) | 2021.12.28 |
|---|---|
| Zabbix-agent Auto Registeration ( 자동 등록 ) (0) | 2021.12.23 |
| 오픈소스 모니터링 Zabbix 5.0 설치 (0) | 2021.11.22 |
| Graylog를 이용한 Syslog 수집 ( 수집 설정 편 ) (0) | 2021.10.25 |
| Graylog를 이용한 Syslog 수집 ( 설치 편 ) (1) | 2021.10.23 |


